· Eugene Ostroukhov · Engineering · 10 min read
Stepping through an MLIR pass pipeline in the browser
--mlir-print-ir-after-all prints every pass into one log. MLIR step-through runs upstream mlir-opt in a browser tab and shows each pass as a diff.
Overview
I am learning MLIR, and spend a lot of time trying to understand what each pass does and how they interact with each other. I asked Claude to build a tool for that, and the result is MLIR step-through, which I am eager to share. It runs mlir-opt compiled to WebAssembly, in a browser tab, and shows the pipeline one pass at a time: the input to the pass on the left, its output on the right, diffed line by line.
It is the same driver and the same command line as on your machine, so the output matches mlir-opt from the same LLVM release (23.1.5 at the time of writing). I may extend it to support custom builds later. This post tries to explain how this tool is meant to be used and what it shows:
- Stepping through a pipeline — one pass at a time.
- Comparing steps and pipelines — two steps of the same or different pipelines.
- Defining a custom pipeline — naming, copying, reordering and adding passes.
Stepping through a pipeline
The page opens on the first example, a small linear layer — linalg.matvec plus linalg.add on tensors — lowered to the llvm dialect in eleven passes. The toolbar above the panes holds the pipeline on the left and the current pass between ← and →. The arrow keys do the same.
Step 0 is the input after one run through mlir-opt with an empty pipeline, printed the same way as the dumps. Without it the first diff would be mostly the printer — %x renamed to %arg0, 0.0 reprinted as 0.000000e+00 — rather than the first pass.
The pass list
The pass picker lists every pass in the run with the number of lines it added and removed. That alone answers the first question I usually have about a pipeline: which passes actually did something. In this one, canonicalize, cse and expand-strided-metadata are all ±0 on this input.
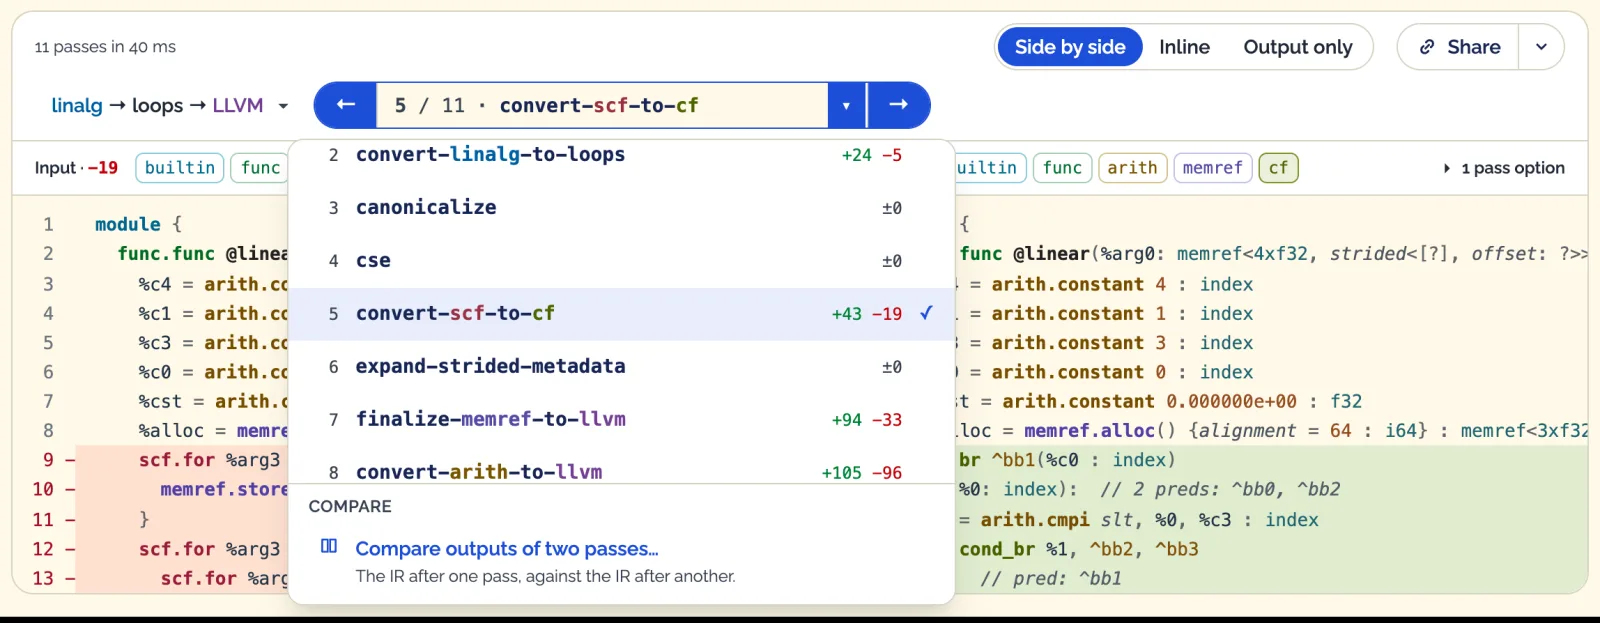
Typing a step number in the open list jumps to it. The last row, Compare outputs of two passes…, is covered further down.
Dialects appearing and disappearing
Above each pane is a row of chips, one per dialect present in that IR. A lowering pipeline is, more or less, a sequence of dialects leaving and others arriving, so the chips mark where each one happens: a dialect struck out on the left (linalg on the screenshot) is gone in the output, and a filled one (scf on the screenshot) on the right is new.
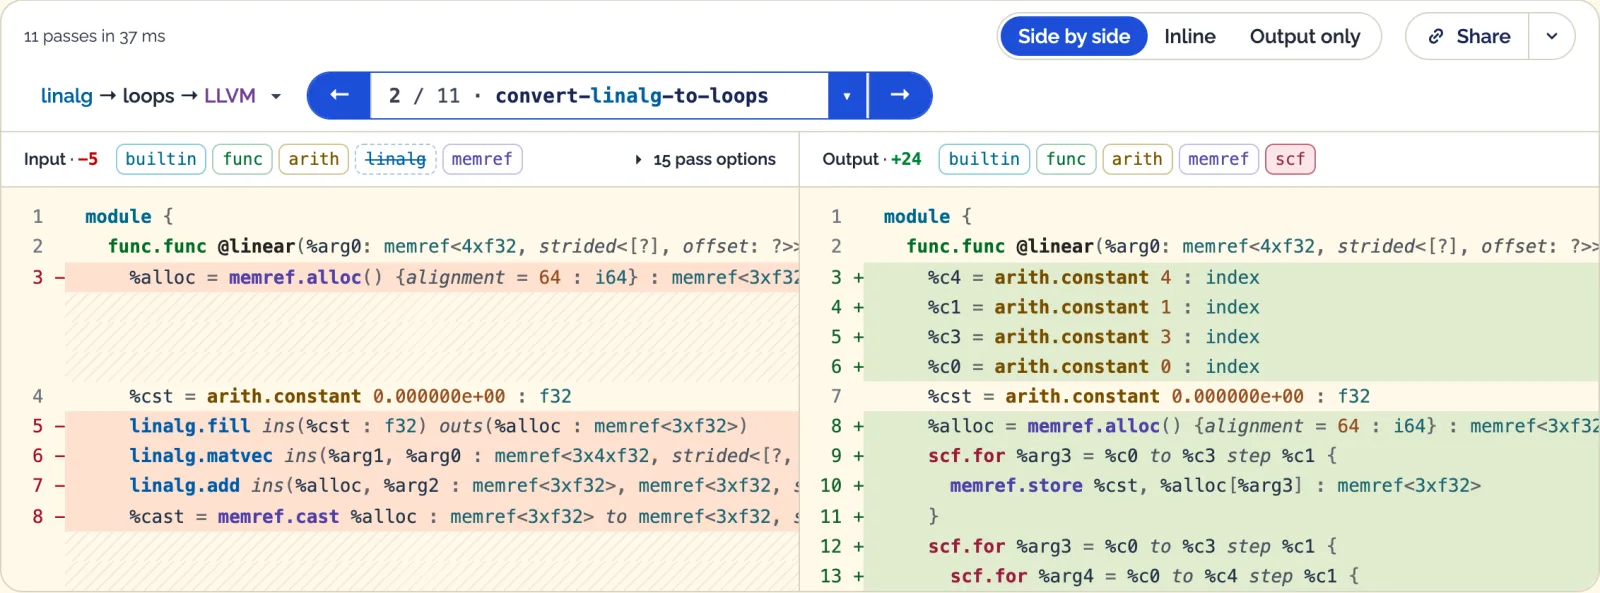
Highlighting a dialect’s ops
Each dialect’s ops have their own color in the viewer. To focus on one dialect, use its chip above the panes.
Hovering a chip highlights every op of that dialect in its pane. Clicking it scrolls to the first one, and each further click moves to the next, with the position shown on the chip. That is the quickest way I found to answer “where did all these llvm ops come from”.
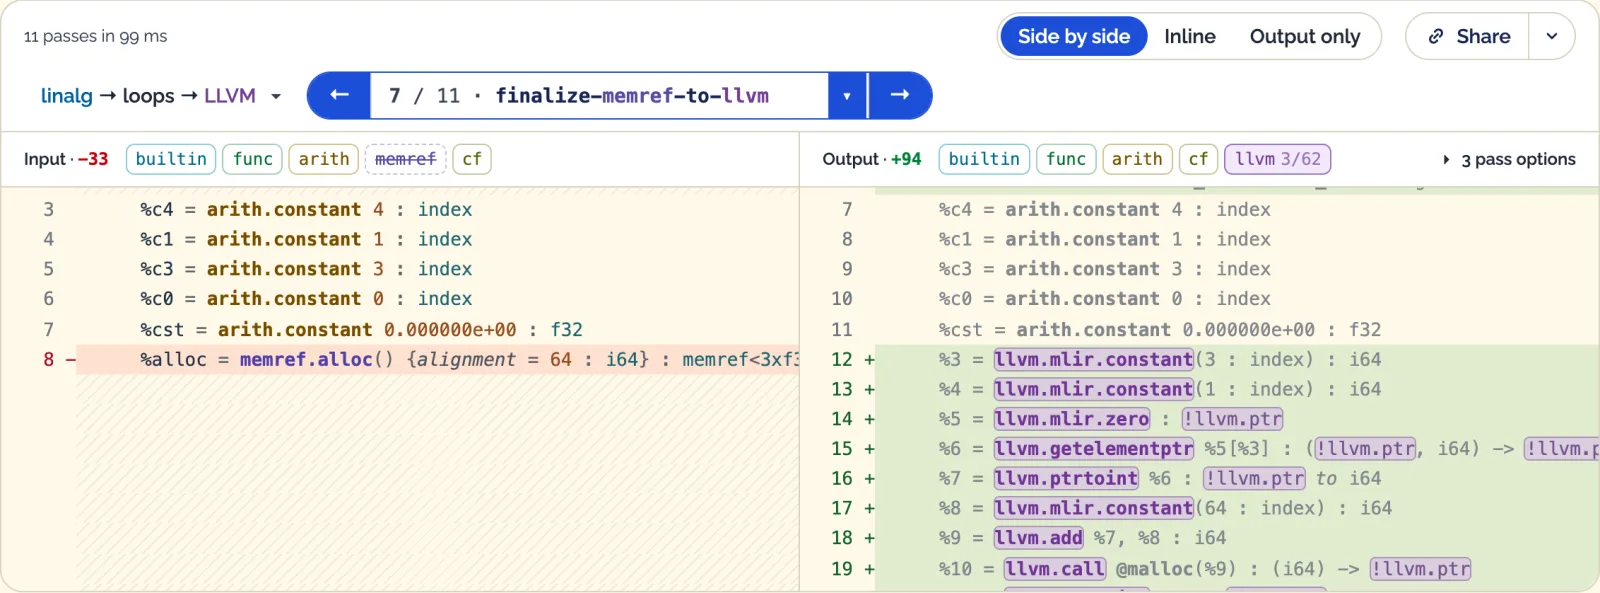
Here finalize-memref-to-llvm turned a single memref.alloc into a dozen llvm ops: a size computed with llvm.getelementptr on a null pointer, a call to malloc, and the memref descriptor assembled around the result.
Following values and symbols
Hovering a name highlights all of its uses: an SSA value such as %alloc, a block label such as ^bb1, or a symbol such as @saxpy_kernel. Values and blocks are scoped to the function they live in — %3 in two functions is two different values. Symbols are module-wide.
The GPU outlining example shows why that matters. gpu-kernel-outlining moves the body of a gpu.launch into a new gpu.module, and leaves a gpu.launch_func that refers to it by symbol. Hovering the symbol at the call site lights up its definition as well.
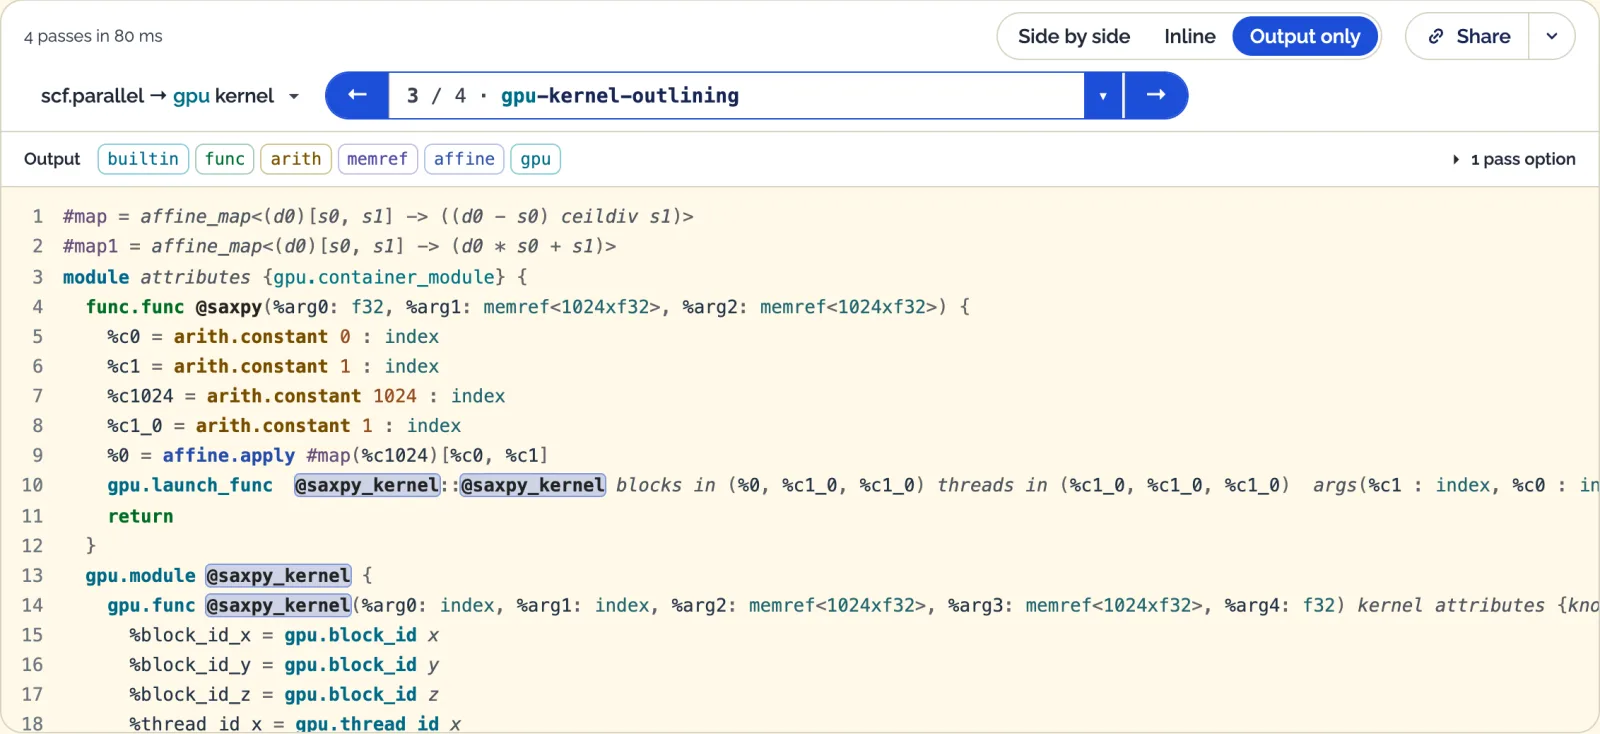
The match is by name, so gpu.module @saxpy_kernel and the gpu.func @saxpy_kernel inside it light up together. The outlining pass gives them the same name; @saxpy_kernel::@saxpy_kernel at the call site is the nested reference to the function inside the module.
Comparing steps and pipelines
A lowering often spreads over several passes, with no-op passes in between. Sometimes the question is what a stretch of passes did, or what another pipeline would have done.
Two steps of one pipeline
Compare outputs of two passes… at the bottom of the pass list switches to two independent steps, one per side.
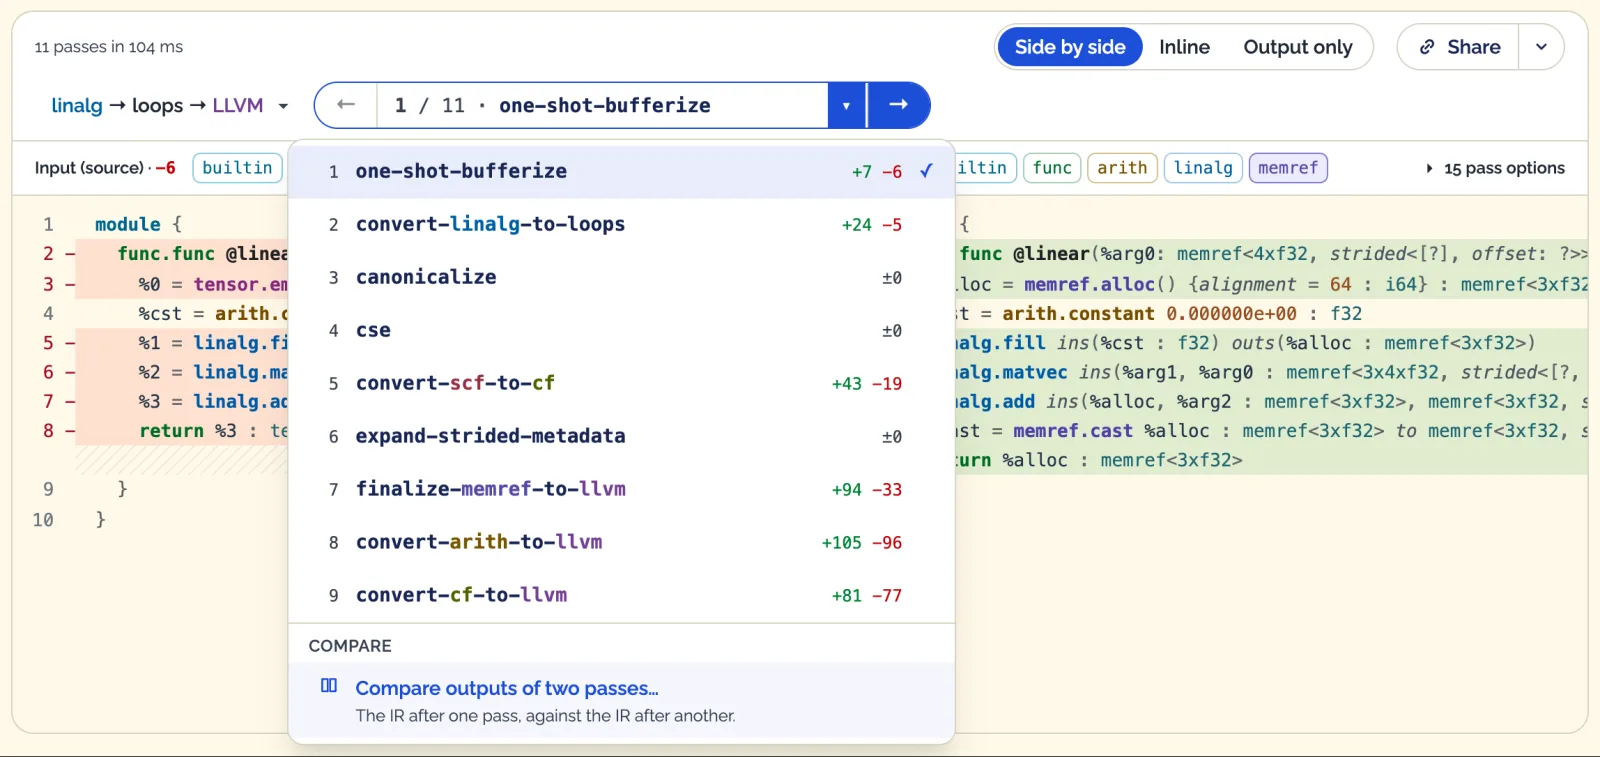
With the left on the IR after one-shot-bufferize and the right after convert-scf-to-cf, everything in between collapses into a single diff, and the chips show linalg going straight to cf — the scf loops came and went in between.
The right step list counts lines against the left step instead of against the previous pass, so it doubles as a map of where the IR actually changes relative to a fixed point. ← and → move the right side; Show this pass alone goes back to one pass.
Two pipelines on the same input
The pipeline list has a Compare pipelines… row at the bottom too. It runs a second pipeline on the same source and shows it on the right, each side with its own pipeline and step pickers.
Below, the same linear layer source goes through convert-linalg-to-loops on the left and convert-linalg-to-affine-loops on the right, both followed by canonicalize. scf is struck out on the left and affine is new on the right. The affine version needs none of the four arith.constants of index type, because the loop bounds are written into affine.for directly.
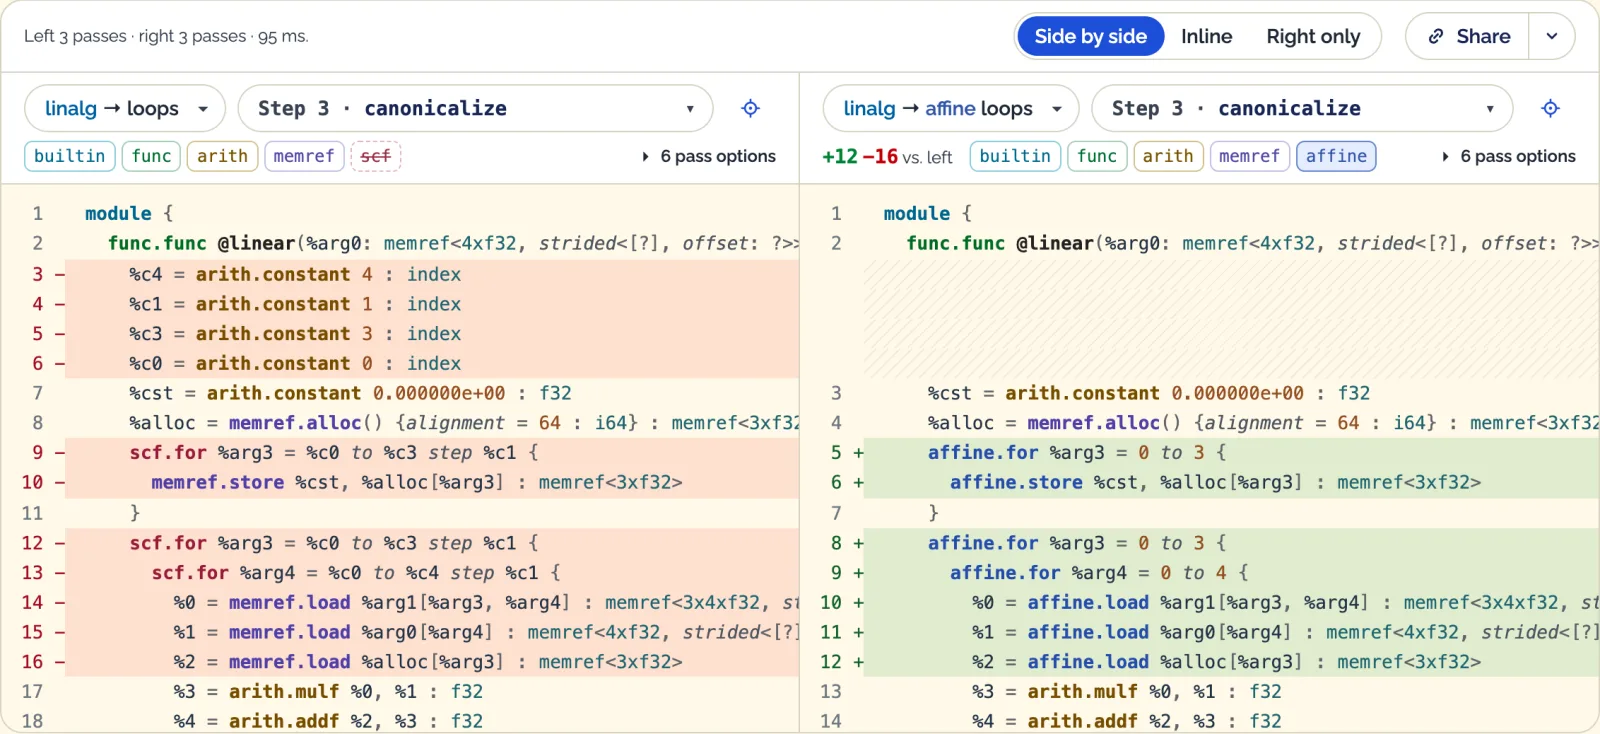
Side by side gets cramped with long lines. Inline puts both sides in one column as a unified diff, and Output only (or Right only, when comparing) drops the diff altogether.
Defining a custom pipeline
The examples come with their pipelines, but the point of the page is trying your own. The way in is the pipeline list, the pill left of the pass picker (linalg → loops → LLVM here): Edit… sits under your own pipelines and the examples. When comparing, each side’s pipeline list has its own Edit… for that side.
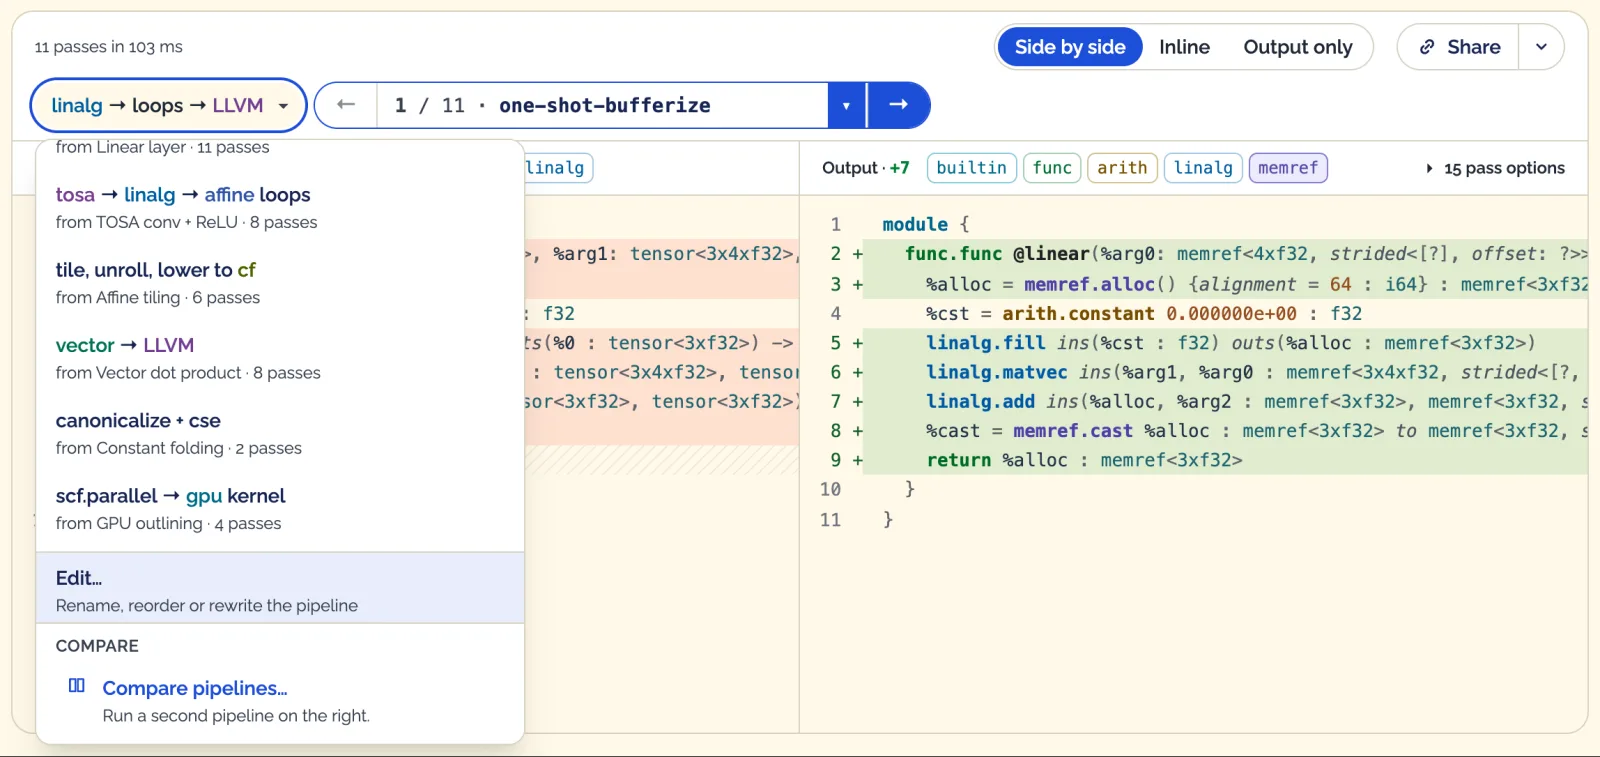
It opens the MLIR Pipelines dialog over the page, as tall as the window, so a long pipeline fits without scrolling. The runs keep going behind it: every change reruns mlir-opt, and the line at the bottom of the dialog says how the run went.
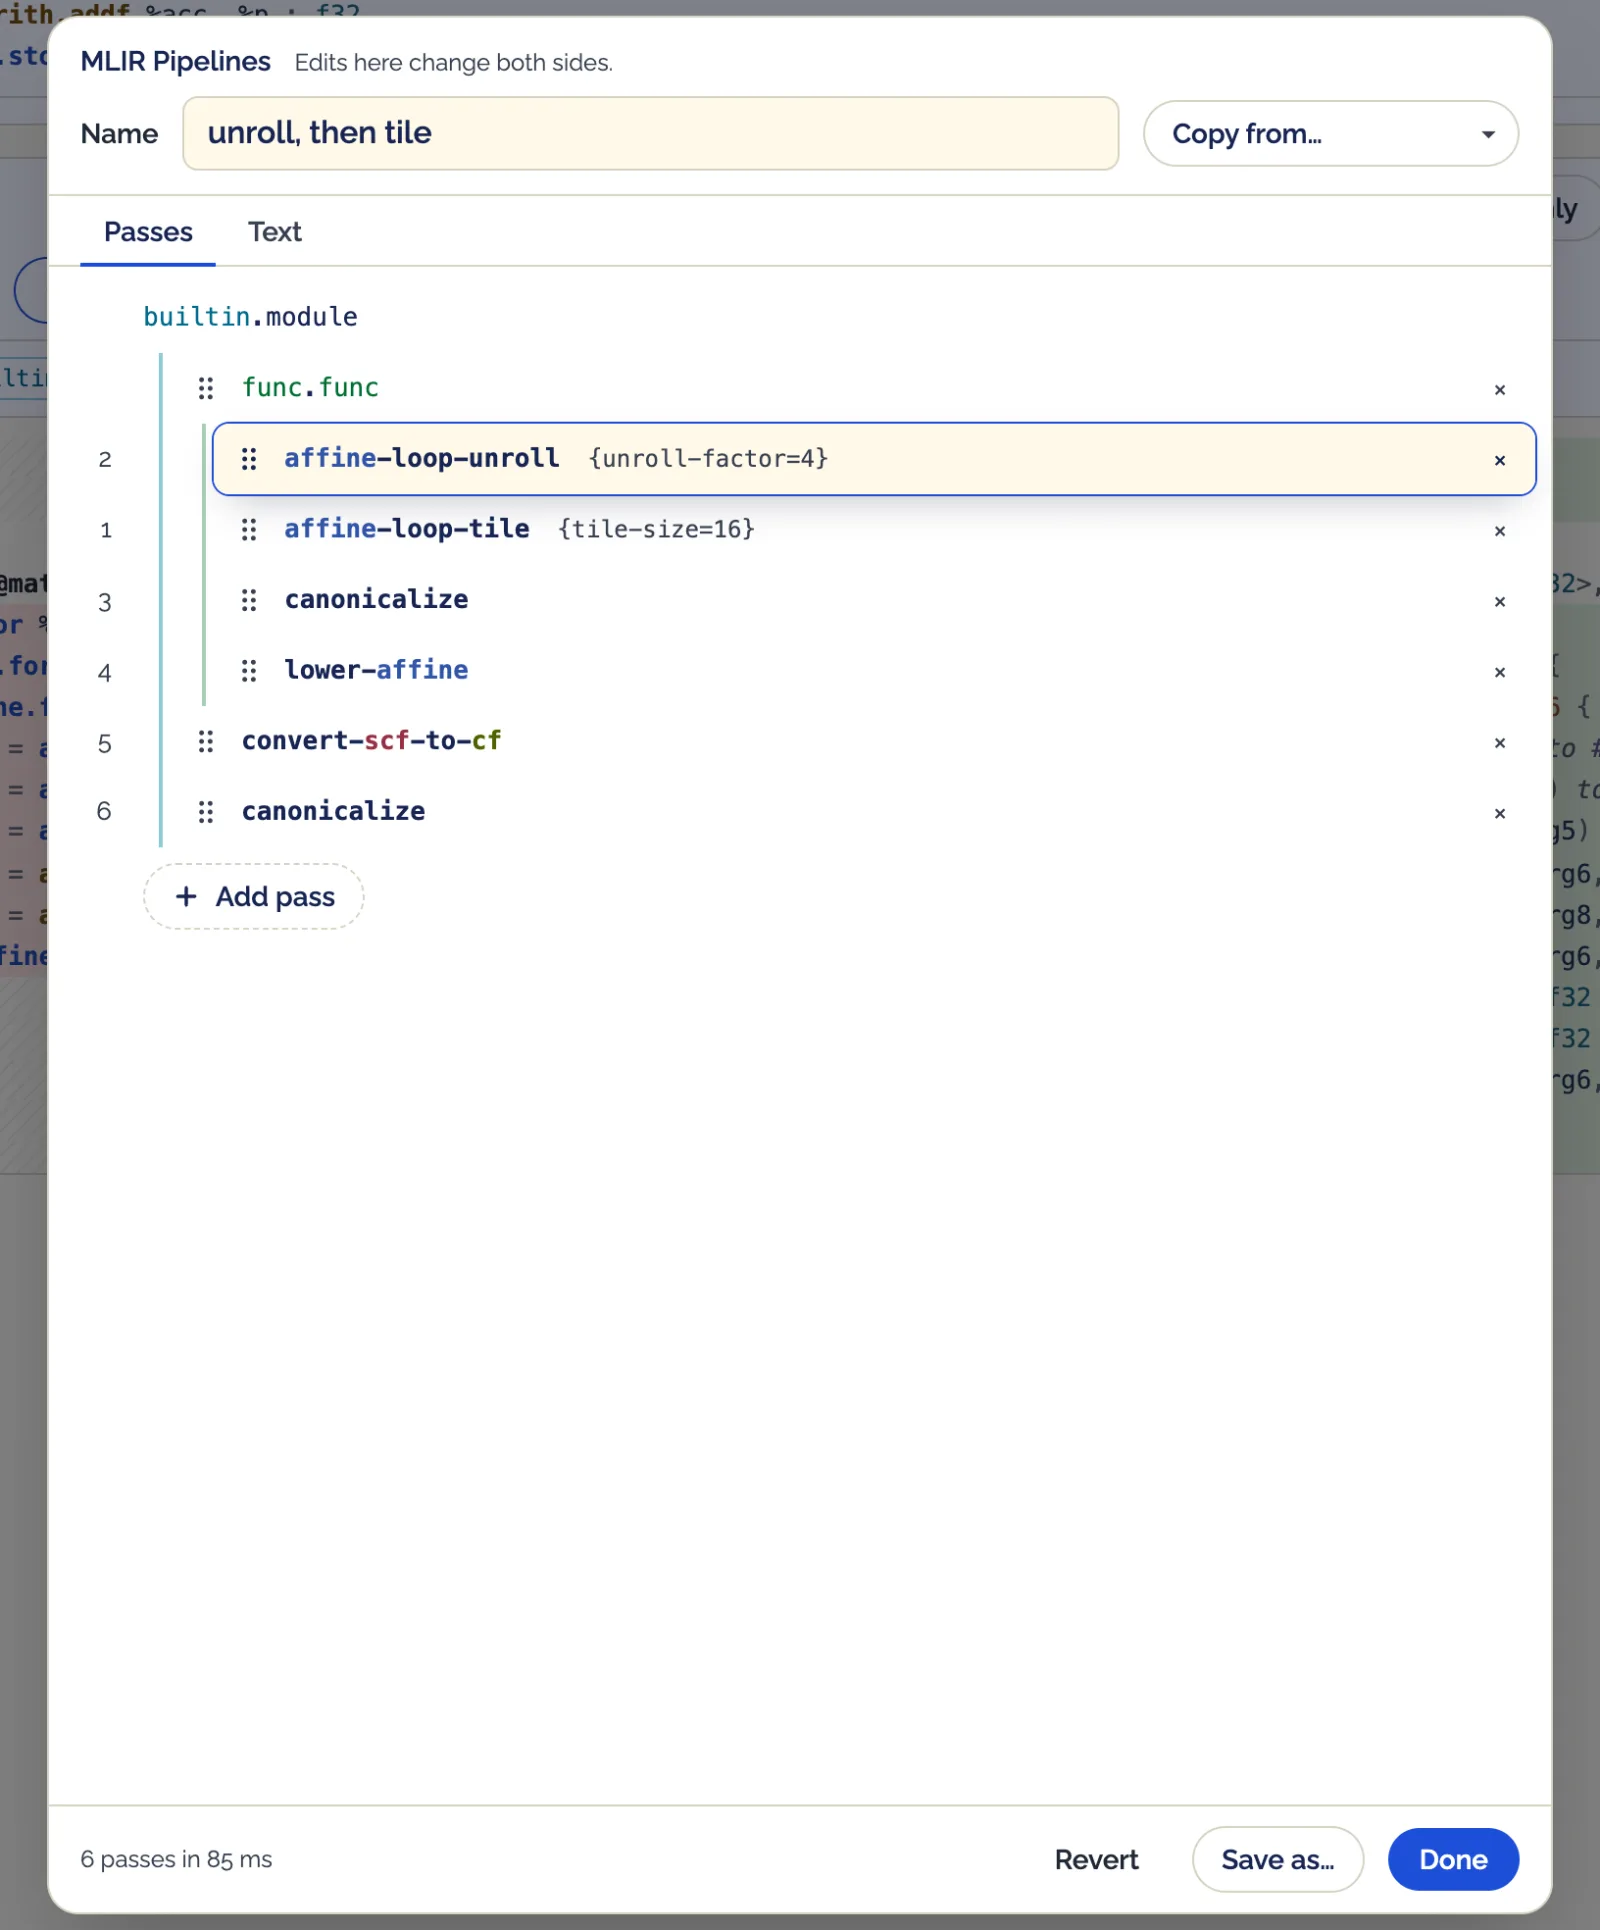
The top of the dialog holds the pipeline’s name and Copy from…. A name is optional: left empty, the pipeline keeps the generated one (affine → cf for this example); typed, it replaces it in the pipeline lists and goes into the share link along with the pipeline itself. Copy from… replaces the pipeline with one of the examples, a saved one, or the other side’s, as a starting point.
The Passes tab lists the pipeline one pass per row, nested under the op it runs on. A pass moves by dragging its handle. Clicking the handle instead opens a menu with Move up, Move down, Move to top and Move to bottom, and ↑ or ↓ on a focused handle moves it one place; × removes it. Moves stay inside the pass’s own group, so a pass never quietly changes the op it runs on — func.func(...) moves as a whole, with its passes. A pass’s options — {tile-size=16} — are edited in place: click them, change them, press Enter.
Remembering the exact name of a pass is the hard part, so Add pass searches the 315 passes this mlir-opt build registers, with the description from its own --help. The chosen pass goes right after the pass last picked in the list, or at the end when none is, nested under the op it can run on — a pass restricted to func.func lands inside func.func(...).
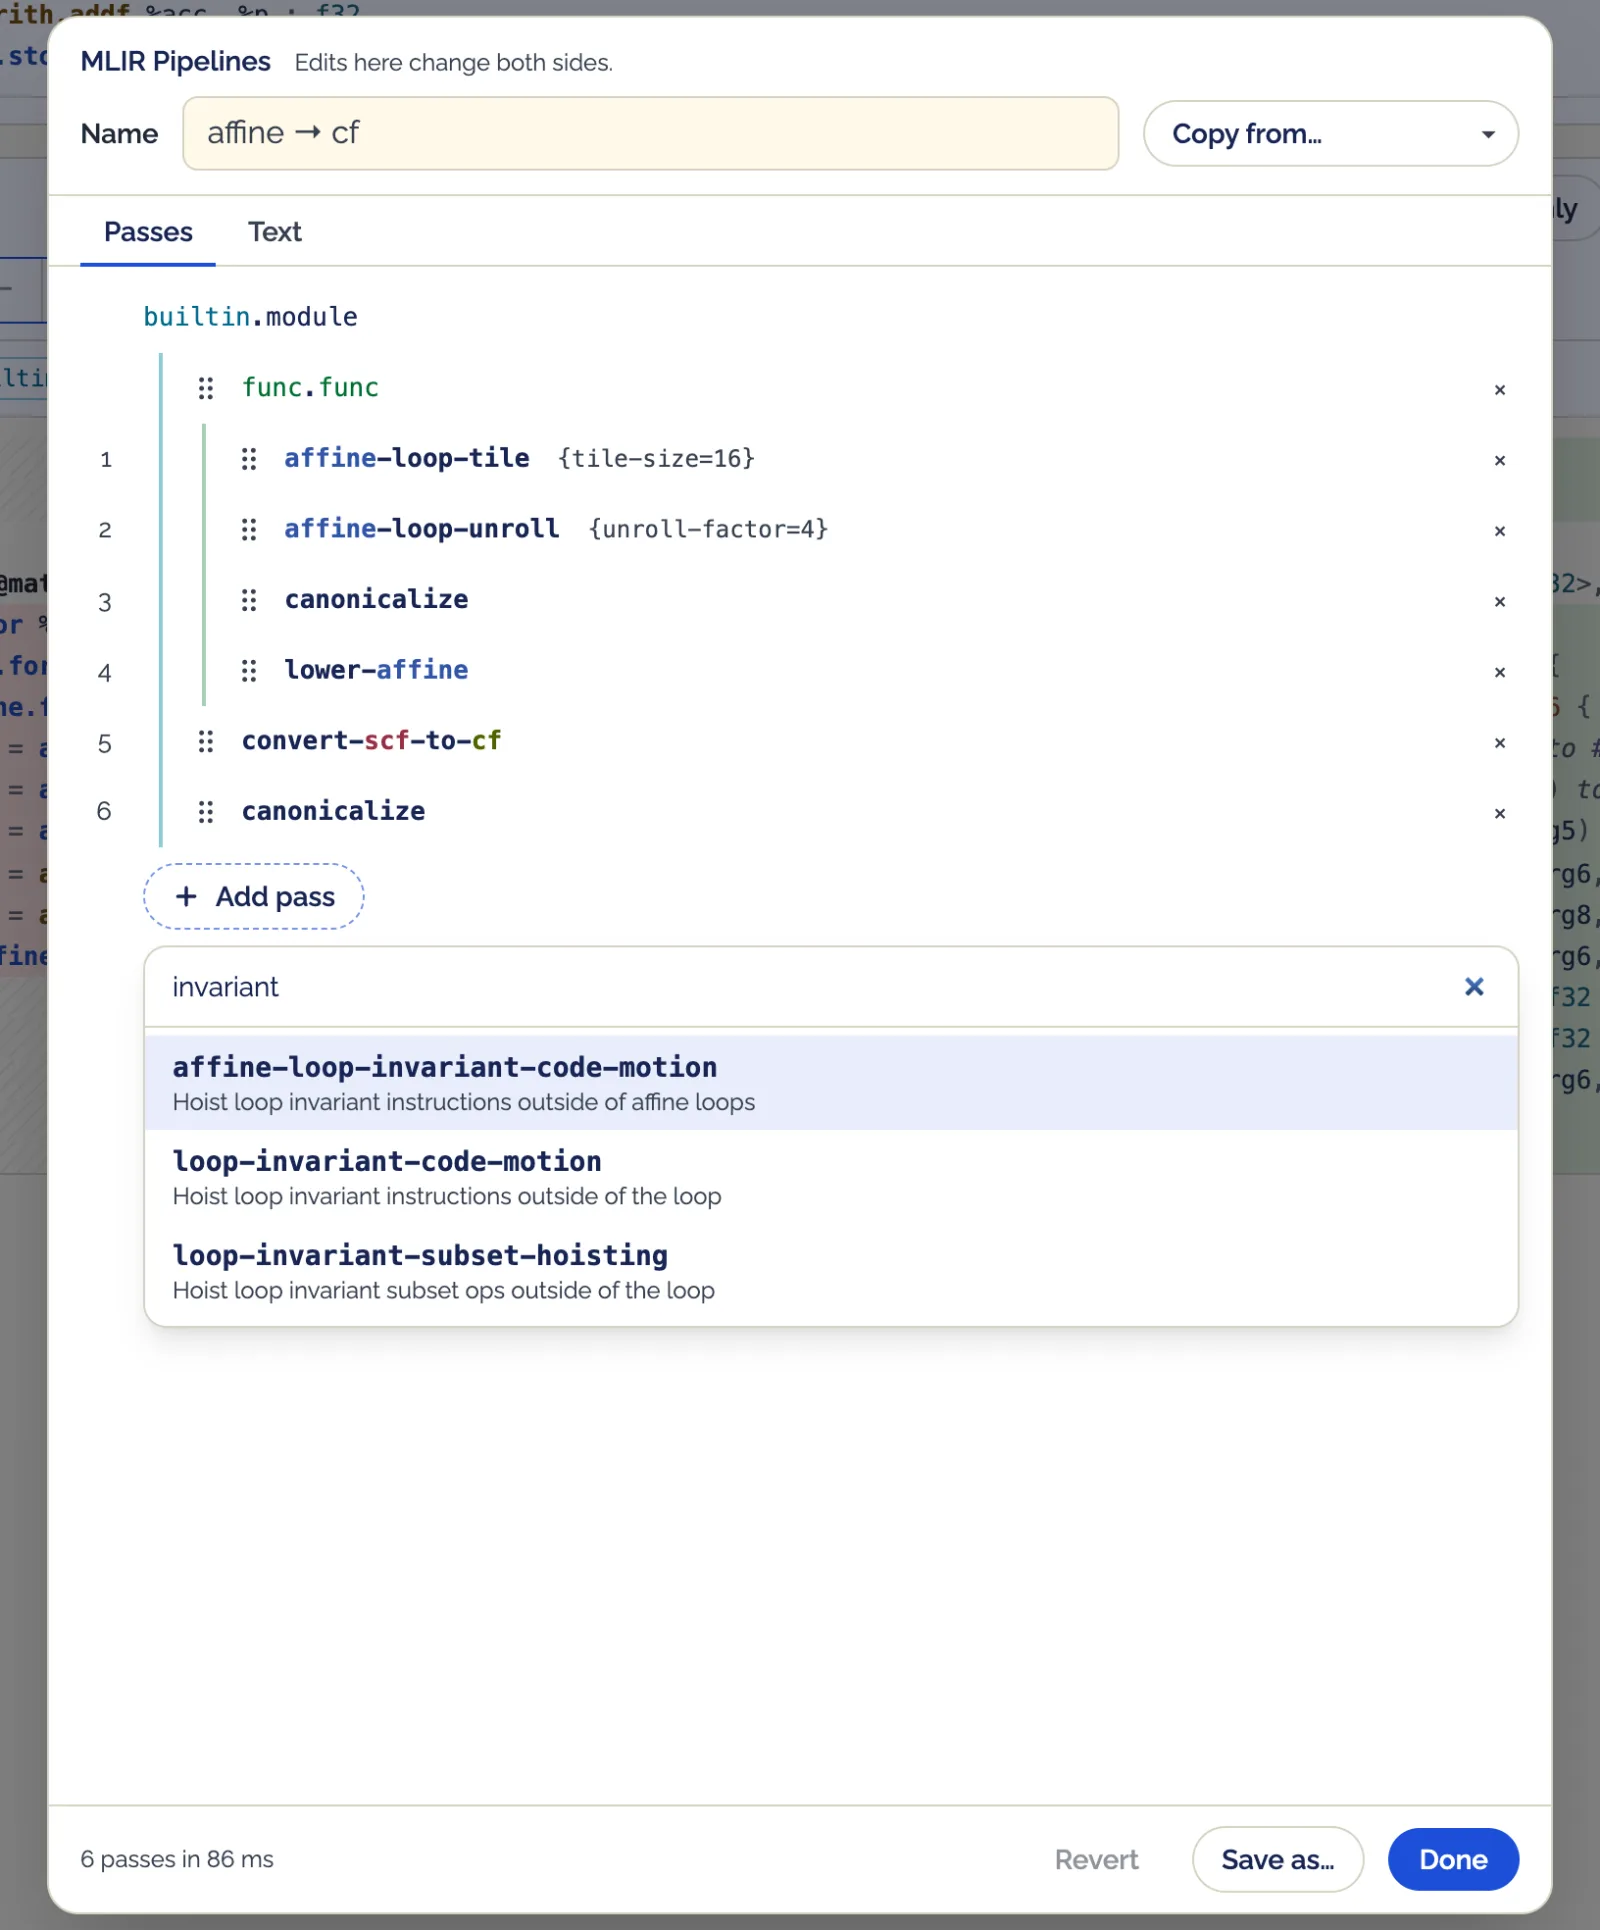
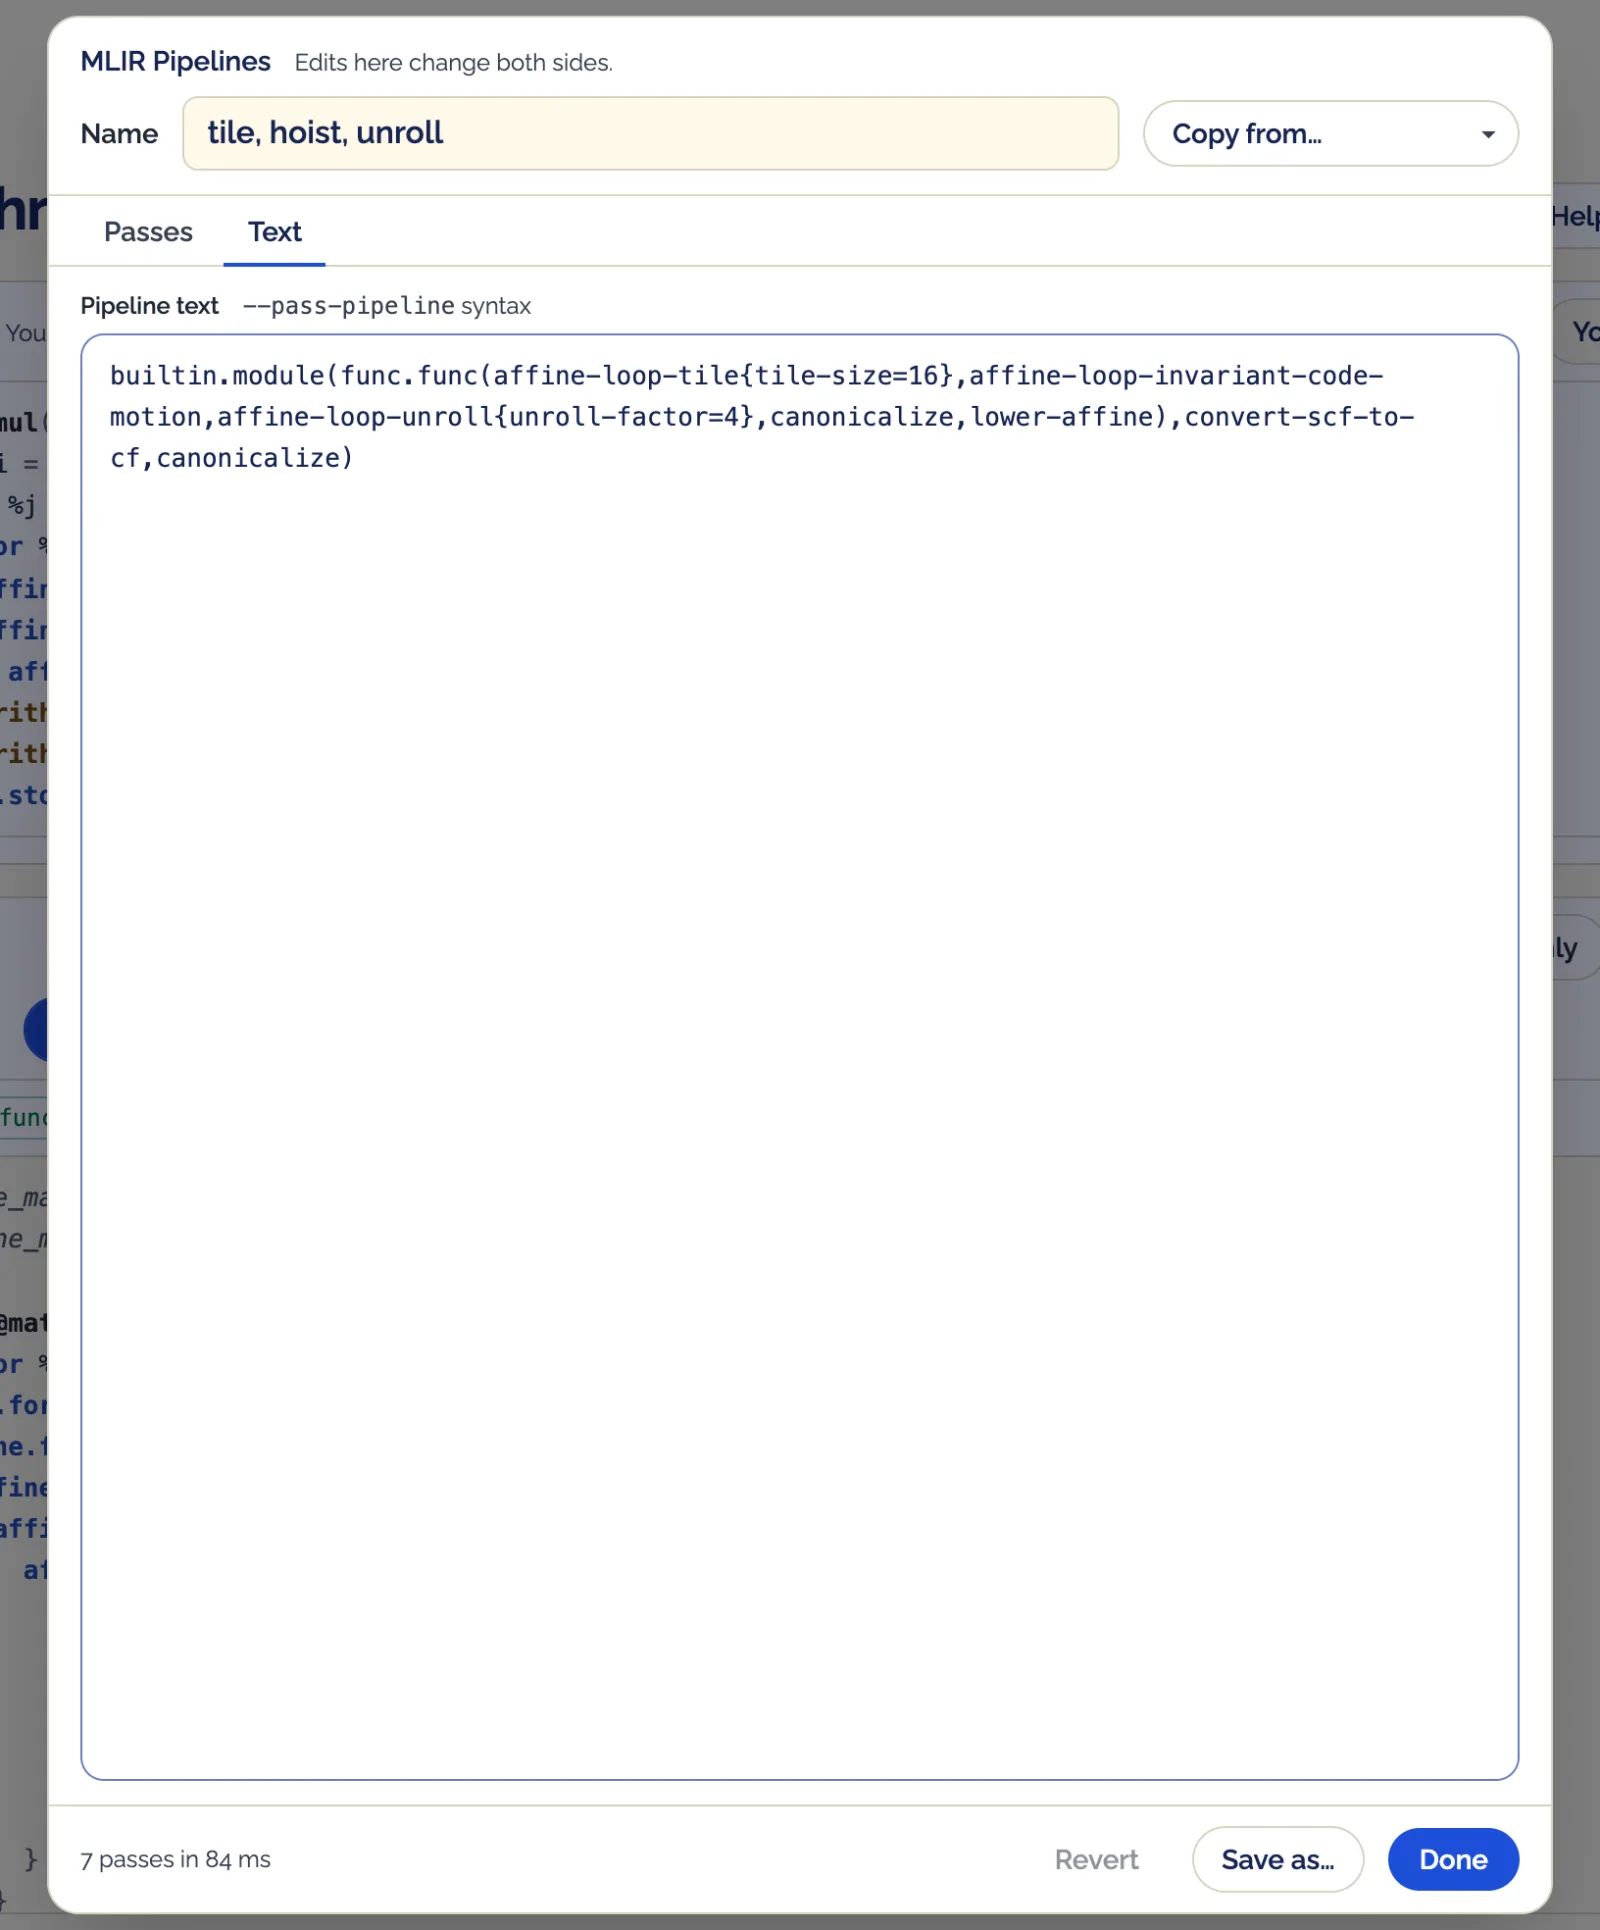
Anything the list does not do is a matter of the Text tab: the same textual syntax --pass-pipeline takes, edited directly. It reruns once typing settles, or at once with ⌘/Ctrl+Enter. That is also how a pass gets into a different group. For this post I put affine-loop-invariant-code-motion right after affine-loop-tile inside the first func.func(...) of the Affine tiling example, a 64×64 matmul, and named the result.
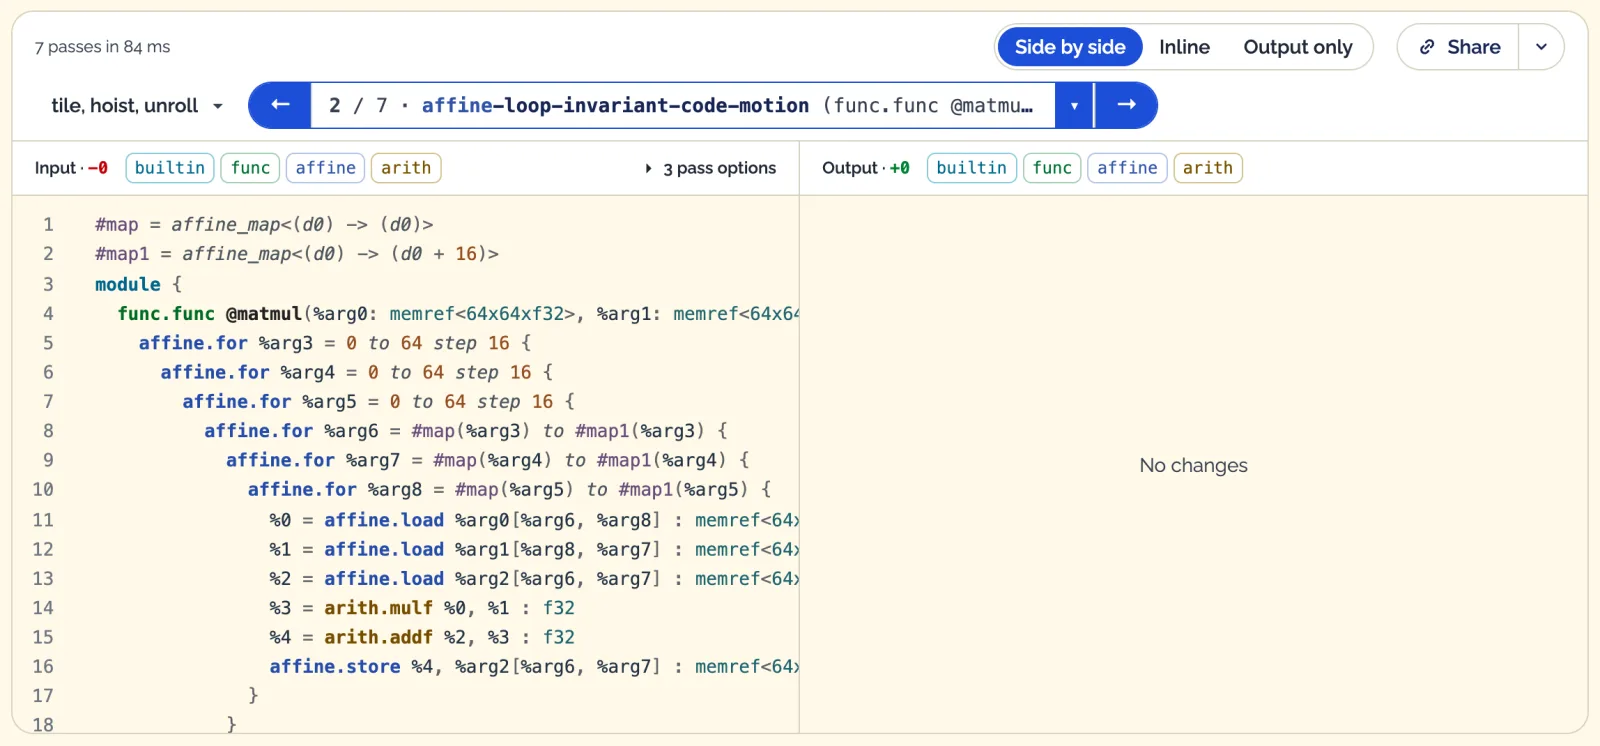
It turned out to be a no-op: its step shows No changes. In the tiled loop nest every load depends on the innermost index except the one from the output matrix, and that one is stored to in the same loop, so it stays put.
Done or Escape closes the dialog; Revert puts back the pipeline and name it opened with. The edit stays in the pipeline list under Custom pipelines, so it and the example it came from are one click apart — or both on screen with Compare pipelines….
An edit lasts as long as the page. Save as… keeps it under a name in this browser, for the next visit: saved pipelines are listed right after the edits, before the examples, and in Copy from…. A name that is already saved is replaced, and can be deleted from the same place. While the dialog shows a saved pipeline, a badge says whether it changed since: Saved, or Saved · edited with a Save button that keeps the changes under the same name. They stay in the browser — a share link carries only the pipelines on screen, with their names.
The source is editable the same way: paste your own MLIR into the editor at the top and it reruns. Share copies a link that holds the source, both pipelines with their names, and the two steps on screen, packed into the part of the URL after the #, which browsers never send to a server.
I am not done with the tool yet. I am considering features like per-pass timing and a final mlir-translate step to LLVM IR. Bugs and requests go to GitHub issues.
My notes from building UchenML
Check your inbox
If that address is new here, a confirmation link is on its way. Click it to finish subscribing.
C++ machine learning compiled into real products — plus the C++ and performance rabbit holes I fall into around it. Technical, irregular by design.
Double opt-in — I'll send a confirmation email first. Unsubscribe in one click.